How do you know if your ServiceNow UX design is truly successful? Measuring the impact of UX improvements requires a strategic approach to metrics and analytics that goes beyond simple user satisfaction surveys.
Defining Success Metrics
Before you can measure success, you need to define what success looks like for your specific ServiceNow implementation. This typically involves a combination of:
- **Efficiency metrics**: Task completion time, error rates, number of clicks/steps - **Engagement metrics**: Adoption rates, feature usage, return frequency - **Satisfaction metrics**: User satisfaction scores, Net Promoter Score (NPS), support ticket volume - **Business impact metrics**: Cost savings, productivity improvements, ROI
Establishing Baselines
To demonstrate improvement, you need to establish baseline measurements before implementing UX changes. This provides a point of comparison to quantify the impact of your design enhancements.

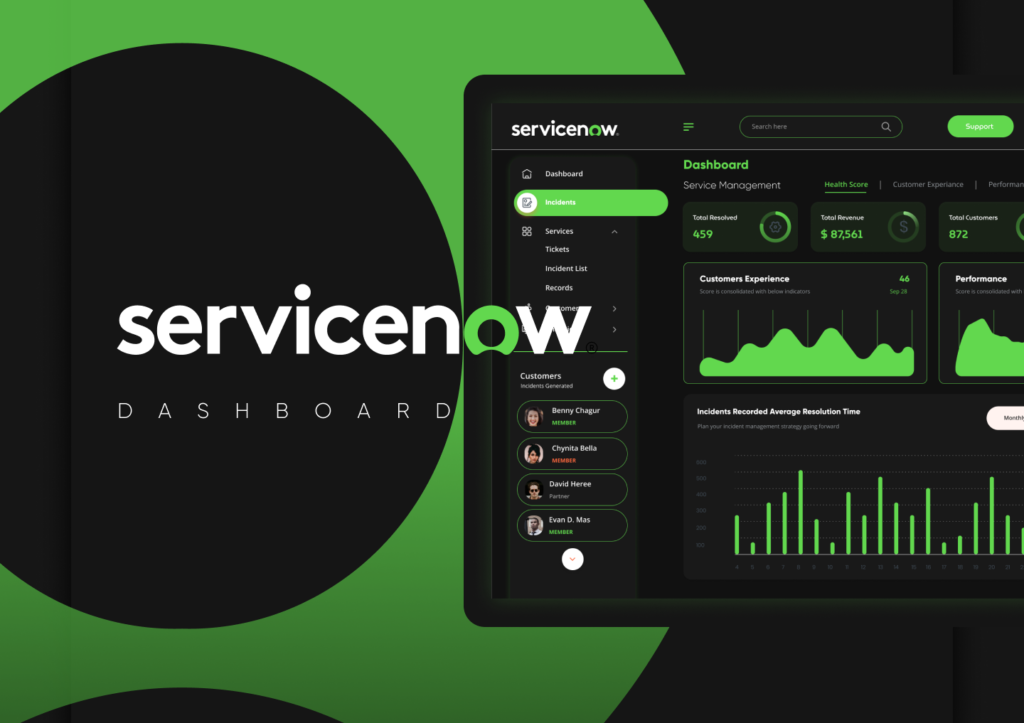
A comprehensive UX dashboard helps track key performance indicators over time.
Qualitative and Quantitative Measurement
The most effective UX measurement combines both quantitative data (analytics, task success rates, etc.) and qualitative insights (user feedback, interviews, observations). This provides both the what and the why behind user behavior.
"Numbers tell you what is happening, but only qualitative research can tell you why it's happening. Both are essential for a complete picture of UX success."
— UX Research Institute
Continuous Measurement and Improvement
UX measurement should be an ongoing process, not a one-time event. Implement continuous monitoring of key metrics and establish a regular cadence for reviewing data, identifying issues, and implementing improvements.
By establishing a robust measurement framework, you can demonstrate the tangible value of UX investments in your ServiceNow implementation and create a data-driven foundation for continuous improvement.